DeepInfer Benchmarks: V4.1-Flash Prefill and Decode
DeepInfer's V4.1-Flash launch numbers are two Pareto charts and a set of eval scripts. They are useful — if you read the axes, the assumptions, and the missing comparisons before you read the headline.
DeepInfer is DeepSeek's open-source inference framework for serving DeepSeek-V4.1-Flash at scale. Its published performance evidence is narrower than the launch conversation: two V4.1-Flash charts on one hardware family, plus offline eval reference scores. No third party has reproduced them yet.
DeepInfer supports NVIDIA SM100 GPUs and Huawei Ascend 950 NPUs, but DeepSeek's published performance charts cover NVIDIA hardware only. That asymmetry is the first thing to keep in mind when reading the numbers.
The two charts
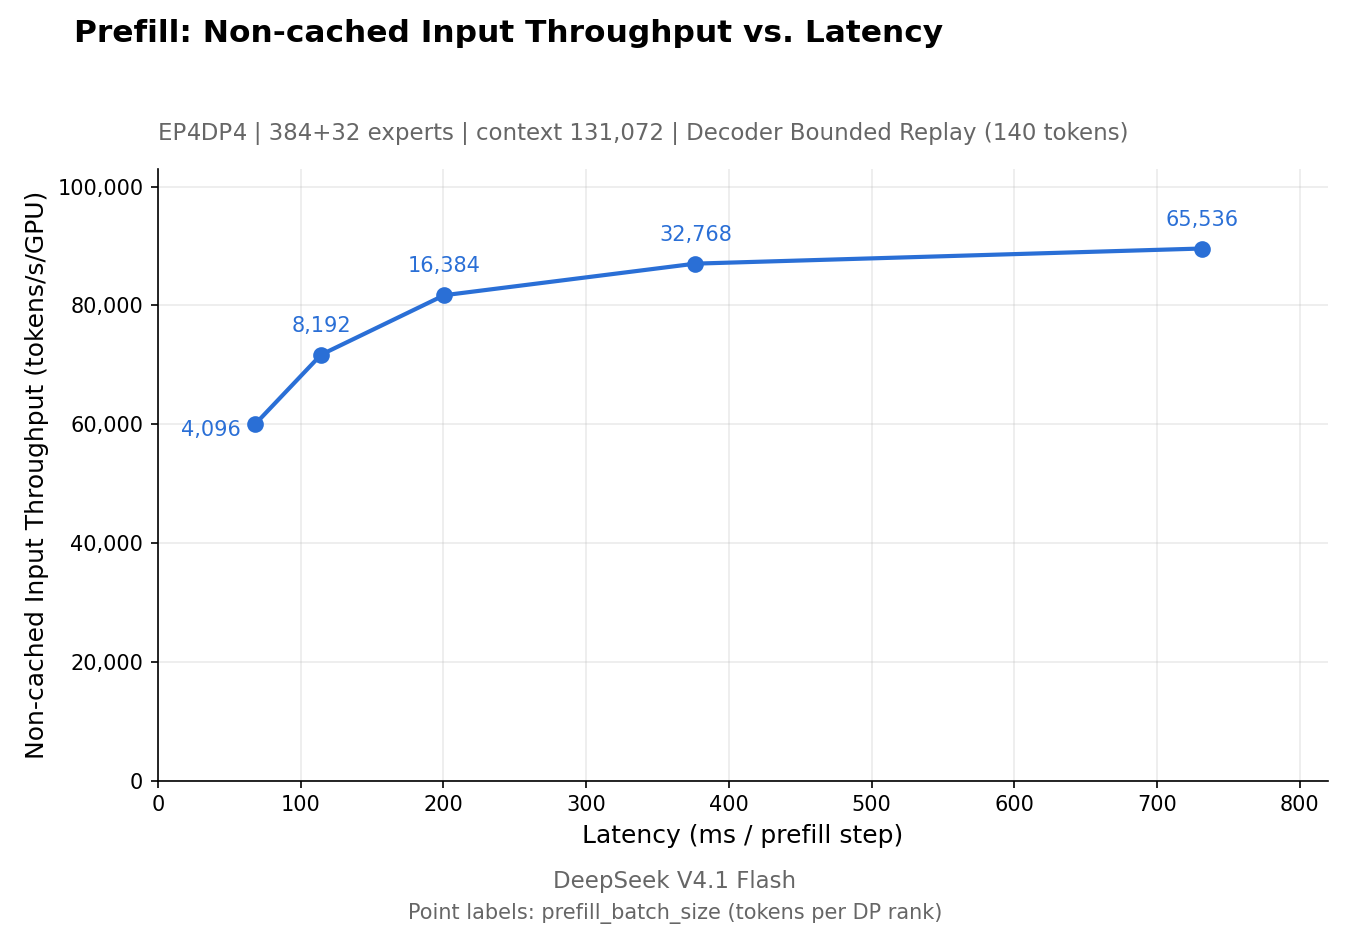
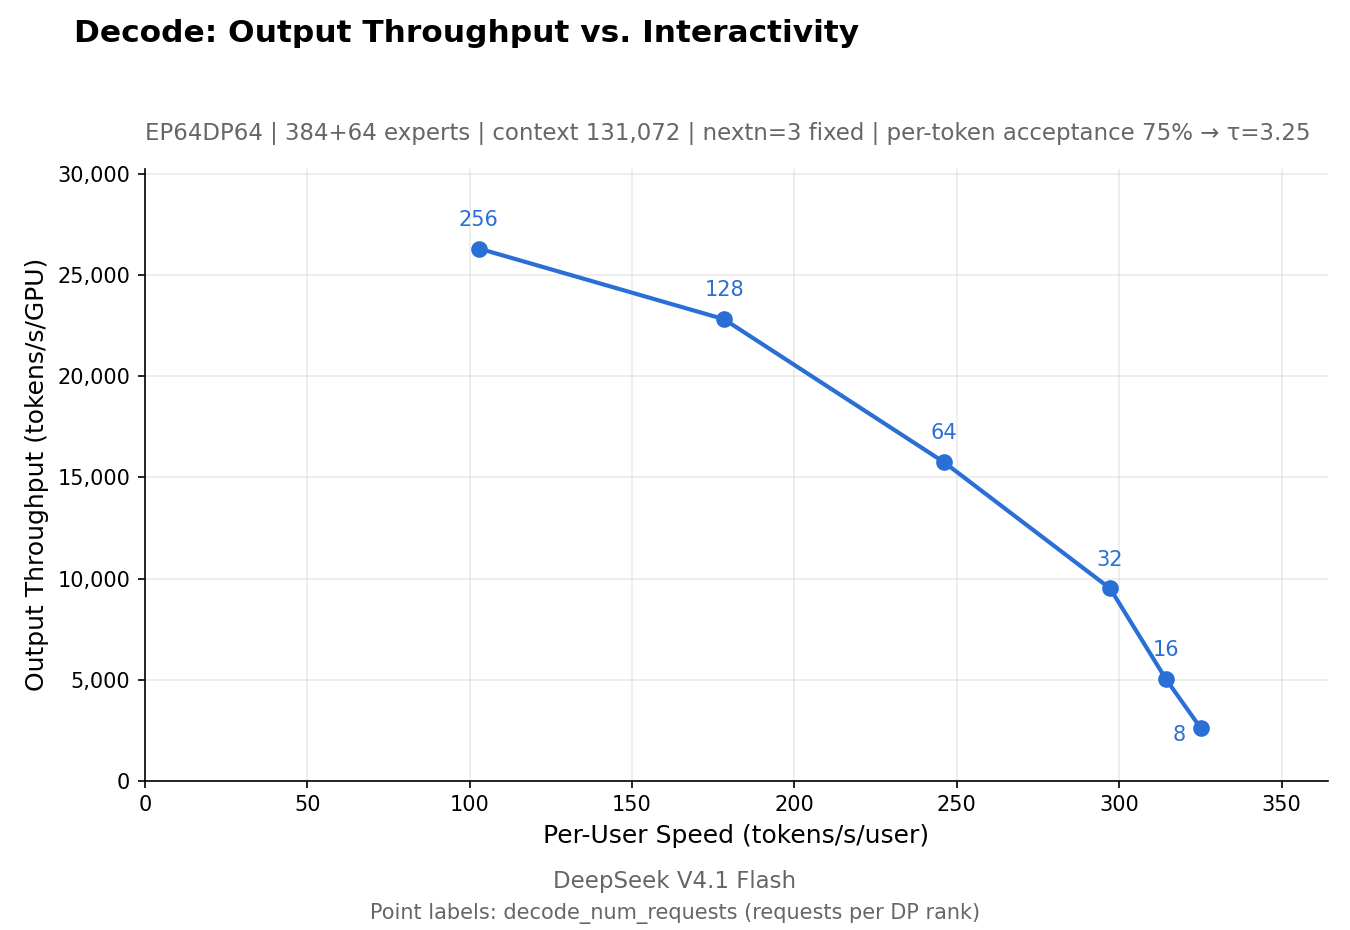
Both charts use a 131,072-token context. The prefill chart uses 4 SM100 GPUs; the decode chart uses 64. Each run is within one scale-up domain.
What the axes mean
| Chart | X axis | Y axis | What a point represents |
|---|---|---|---|
| Prefill | Latency per prefill step (ms) | Non-cached input throughput (tokens/s/GPU) | A batch size; larger batches raise throughput and latency together. |
| Decode | Per-user speed (tokens/s/user) | Output throughput (tokens/s/GPU) | A request count per DP rank; more concurrent requests raise throughput but slow each user. |
Neither chart plots end-to-end request latency. Prefill latency is per step, not time-to-first-token for a real request. Decode per-user speed is an aggregate steady-state figure, not the latency of a single API call. Network, queueing, tokenization, and the serving layer are outside the measurement.
Approximate readout
The charts do not print throughput values; the labels are batch sizes or request counts. The numbers below are read from the axes and rounded. They are useful for understanding the shape, not for procurement.
| Chart | Point | Throughput | Latency / per-user speed |
|---|---|---|---|
| Prefill | 4,096 batch | ~60k tokens/s/GPU | ~68 ms/step |
| Prefill | 16,384 batch | ~81k tokens/s/GPU | ~200 ms/step |
| Prefill | 65,536 batch | ~89k tokens/s/GPU | ~730 ms/step |
| Decode | 8 requests/rank | ~2.6k tokens/s/GPU | ~325 tokens/s/user |
| Decode | 64 requests/rank | ~15.5k tokens/s/GPU | ~248 tokens/s/user |
| Decode | 256 requests/rank | ~26k tokens/s/GPU | ~103 tokens/s/user |
The eval numbers
The repository also ships offline evaluation scripts for three benchmarks. These are reference scores for the model under the default configuration, not a comparison between engines.
| Benchmark | Tasks | Samples | Pass@1 |
|---|---|---|---|
| AIME 2026 | 30 | 32 per task | 99.9% |
| GPQA Diamond | 198 | 8 per task | 93.4% |
| HLE-Full | 2,500 (2,158 text + 342 image) | 1 | 42.6% |
These are reference figures, not guarantees. The eval README says repeated runs may differ by a small margin due to sampling. It also notes that a Pass@1 figure is only valid when coverage_complete is true in summary.json — a useful detail for anyone reproducing the numbers.
The eval pipeline separates generation from scoring, so you can rescore existing outputs with a different judge. The default judge is an LLM service; a deterministic rule-based judge is available for AIME and GPQA, but not for HLE because more than half of its answers are free-form.
What these numbers are not
- Not a comparison with vLLM or SGLang. Both projects have their own V4.1-Flash optimization posts, with different hardware and workloads. There is no public head-to-head.
- Not Ascend 950 data. The README says Ascend 950 is supported, but the charts are SM100-only.
- Not a cost model. Tokens/s/GPU is not dollars per million tokens. Cost needs utilization, electricity, depreciation, networking, storage, and failure overhead.
- Not a real-workload guarantee. The charts use a fixed 131,072-token context and fixed request patterns. Your prompt distribution, output lengths, and cache hit rate will differ.
- Not independently reproduced. We found no third-party replication as of 2026-10-20 11:30 UTC.
How to reproduce
The repository provides a sweep harness:
# Decode: sweep requests per DP rank, nextn=3, plot with 75% acceptance
bash examples/sweep/run_sweep.sh decode ce-128k 131072 3 0.75

# Prefill: sweep batch size
bash examples/sweep/run_sweep.sh prefill pe-128k 131072

# Encoder: fix image size, sweep images per batch
bash examples/sweep/run_sweep.sh encoder ve-800
The sweep writes results.jsonl and a Pareto PNG under sweeps/<tag>/. In multi-node runs, only the node holding dp_rank 0 writes the JSONL; the other nodes exit after finishing. The examples README warns that the profiler perturbs steady-state readings, so the sweeps run with PROFILE=0.
For the eval scripts, place the datasets at the documented paths and run bash eval/aime/run.sh, bash eval/gpqa/run.sh, or bash eval/hle/run.sh. The scripts do not download datasets for you.
The production claim
DeepSeek says one cluster serves 155 trillion tokens per day, with overall revenue of US$38 per GPU-hour at valley pricing. The post does not disclose the cluster size, GPU mix, or measurement window. Revenue is not profit, and the figure cannot be used to derive a cost per token.
This is the number most likely to be misquoted. It is a production scale claim, not a benchmark result, and it is not comparable to the chart's tokens/s/GPU. If you need unit economics, ask for cluster size, utilization, energy cost, and amortization — none of which is in the launch post.
What we'd want next
- A third-party reproduction on SM100, with the exact commit and configuration.
- Ascend 950 throughput and stability data, even if it is a single-node run.
- A head-to-head with vLLM and SGLang on the same hardware, context, and workload.
- An end-to-end serving benchmark that includes the KV cache and load-balancing layers — the parts the release leaves out.
- Cost per million tokens under a stated utilization and energy price.
Until then, the right reading is: these charts show that DeepSeek's engine can trade latency for throughput in a plausible way; they do not tell you what your cluster will do.
Next: a deeper guide to reading inference benchmarks, what the missing pieces mean, or the comparisons: DeepInfer vs vLLM, vs SGLang, vs TensorRT-LLM.